An excavator sits idle for two days waiting on a part. Meanwhile, the crew rents a replacement at $900 a day because the job can’t stop. Nobody flagged the part shortage, nobody tracked the rental cost against the excavator’s own budget, and by the time someone adds it up at month end, it’s just “maintenance was expensive this quarter.”
That’s what construction equipment fleet management looks like when it’s running on instinct instead of data: a mix of owned trucks, rented equipment, and heavy machinery spread across jobsites, with costs and downtime that are easy to feel and hard to pin down. Whether you’re running a concrete, asphalt, excavation, or crane rental fleet, the same blind spots tend to show up: nobody can say with confidence which asset is costing the most, which jobsite has the worst downtime pattern, or whether a rental was actually cheaper than fixing what you already own.
This guide breaks down where construction fleet management operating costs actually come from, what to put on a construction fleet management KPI dashboard, and how to turn that data into better repair, replace, and rental decisions. It’s written for the people who feel these costs directly: construction business owners, operations and maintenance managers, shop foremen, and safety and compliance leads running fleets in the 10 to 49 asset range.
Construction Fleet Management at a Glance
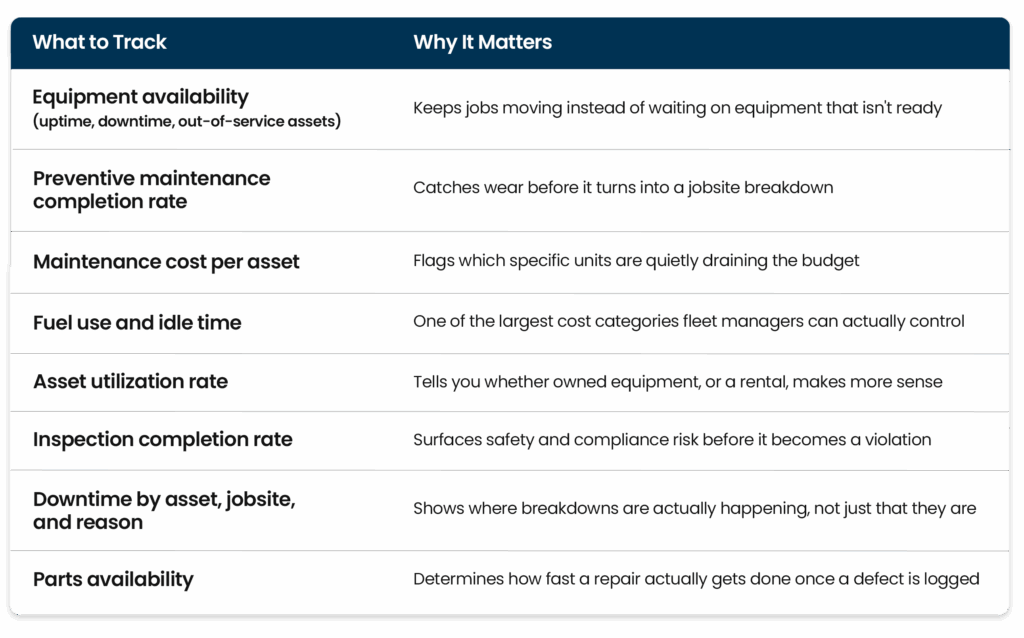
Before building out a full dashboard, it helps to know which metrics matter most and why. For a deeper look at how fleet management ties into safety, compliance, and asset value, our guide to the importance of construction fleet management is a useful starting point.
The Real Cost Drivers in Construction Fleet Management
Construction fleet management operating costs rarely come from one obvious place. They come from a handful of categories that compound quietly over a project or a season:
- Unplanned repairs. A breakdown mid-project costs more than the parts and labor. It’s the crew standing around, the rental filling the gap, and the schedule slip that follows. Equipment downtime on construction sites can run $450 to $760 an hour for heavy machinery, depending on the asset, which makes even a single half-day breakdown an expensive event.
- Fuel and idle time. Heavy equipment burns fuel while idling on a jobsite waiting for the next task, and that cost adds up fleet-wide even though no single instance looks significant.
- Rental duplication. Renting equipment to cover a gap while an owned asset sits in the shop, or sits unused on another site, is one of the most common and least visible cost leaks.
- Parts and inventory carrying costs. Stocking too much ties up cash. Stocking too little stretches every repair out by days.
- Depreciation and resale value. Equipment that’s poorly maintained loses resale value faster, which shows up as a loss well after the maintenance decision that caused it.
- Labor and technician time. Time technicians spend diagnosing a problem that could have been caught on a routine inspection is a cost that rarely gets its own line item.
- Insurance and compliance exposure. A fleet with gaps in its inspection or maintenance records faces more than an audit headache. It faces real financial exposure if a poorly maintained asset is involved in an incident.
Fleets running commercial trucks alongside heavy equipment feel this compounding effect even more directly. According to the American Transportation Research Institute, the average operating cost per mile for trucking rose to $2.26 in 2024, up significantly since 2020, with maintenance and repair as one of the fastest-growing line items.
Where Construction Fleets Lose Money First
Most construction fleets don’t lose money in one dramatic event. They lose it in the gap between when a problem is first visible and when someone actually acts on it.
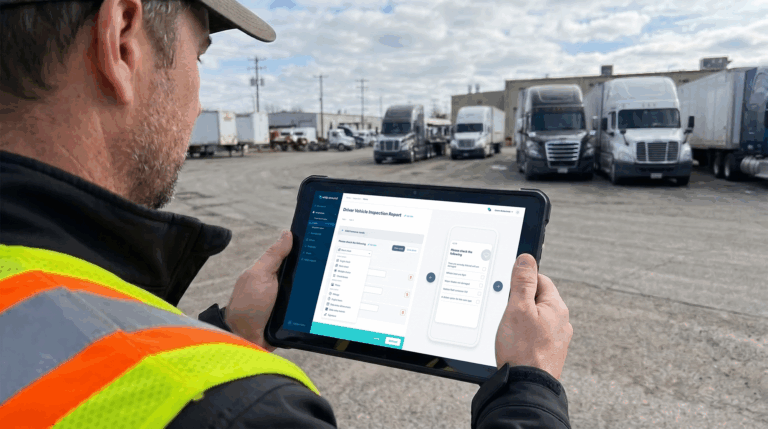
The most common pattern: a driver or operator notices something during a pre-trip check, but the report lives on paper or in a text message that never makes it to the person who schedules repairs. By the time the issue becomes a work order, it’s no longer a small fix, it’s a breakdown.
The second pattern is equipment sitting idle without anyone noticing. Up to 30% of equipment time on construction projects can go idle, and idle equipment that isn’t being tracked is capital that isn’t earning its place in the fleet.
The third pattern is inconsistent maintenance tracking across multiple jobsites. When one site’s mechanic keeps notes on a clipboard and another relies on memory, nobody at the company level can see which assets are actually costing the most, or catch the pattern before it repeats across the fleet.
Each of these patterns has the same fix: visibility that doesn’t depend on someone remembering to mention it. That’s the entire argument for building out proper construction equipment fleet management practices instead of running maintenance and inspections on an ad hoc, per-site basis.
Construction Fleet Management KPI Dashboard: Metrics to Track Weekly
A construction fleet management KPI dashboard only works if it tracks metrics that connect directly to decisions: repair now, replace this unit, stop renting for this job type. These ten metrics form the core of that dashboard.
Equipment Availability Rate
Equipment availability rate measures the percentage of scheduled time an asset is actually operational: (available hours / total scheduled hours) x 100. This is the metric operations leaders check first, because every other KPI on this list exists to protect it. A drop in availability for a specific asset class is usually the earliest sign of a maintenance problem building underneath.
Preventive Maintenance Completion Rate
This tracks completed preventive maintenance tasks against scheduled ones: (completed PMs / scheduled PMs) x 100. Fleets with a strong PM completion rate see fewer surprise breakdowns, because the wear that causes them gets caught on schedule instead of found in the field. A completion rate that’s slipping is often the first warning that unplanned repairs are about to rise.
Inspection Completion Rate
Inspection completion rate shows what share of scheduled pre-trip, post-trip, and equipment inspections actually get completed and submitted. Low completion rates mean defects are going unreported, not that equipment is defect-free. This metric matters as much for safety and compliance as it does for maintenance planning.
Open Defects and Defect Resolution Time
This pairs two numbers: how many reported defects are still unresolved, and how long resolution is taking on average. A growing backlog of open defects, or resolution times that keep stretching, signals a workflow problem between the person reporting the issue and the person assigned to fix it.
Downtime by Asset, Jobsite, and Reason
Total downtime is a lagging number. Downtime broken out by asset, jobsite, and cause is what tells you what to actually change. An excavator that’s down repeatedly for the same hydraulic issue is a different problem than a fleet-wide pattern of parts delays.
Maintenance Cost per Asset
Maintenance cost per asset totals labor, parts, and outside vendor costs for each unit over a given period. Tracking this consistently, asset by asset, is how you find the specific trucks or machines that are costing more to keep running than they’re worth, well before a major failure forces the decision.
Planned vs. Unplanned Maintenance
This KPI compares the share of maintenance work that was scheduled against work that happened in response to a failure. A healthy fleet keeps most maintenance in the planned category, since unplanned repairs typically come with rush parts shipping, overtime labor, and lost productive time on top of the repair itself.
Fuel Use and Idle Time
Fuel use and idle time tracked by asset reveal inefficiencies that are easy to miss at the fleet level: a machine idling far longer than its job requires, or fuel consumption trending up ahead of any diagnosed mechanical issue. Left unmonitored, this is one of the largest controllable costs in a construction fleet.
Asset Utilization Rate
Asset utilization rate measures how much of an asset’s available time is spent doing productive work: (active hours / available hours) x 100. Low utilization on an owned asset is a strong signal that renting for future jobs of that type, rather than deploying that unit, might be the better financial call.
Parts Availability and Inventory Risk
This tracks how often needed parts are in stock versus backordered, and how that gap is affecting repair turnaround. Parts availability has a direct, measurable relationship to maintenance completion rate and downtime. A fleet that consistently waits on parts is paying for that wait in every other metric on this dashboard.
How to Build a Construction Fleet KPI Dashboard That Managers Will Use
A dashboard that nobody opens isn’t a dashboard, it’s a report nobody reads. A few principles keep it useful:
- Match metrics to the role. A shop foreman needs open defects and parts status. An owner needs cost per asset and utilization trends. Don’t force everyone to scroll through the same view.
- Set a weekly review cadence. Availability and open defects deserve a weekly look. Cost and utilization trends are more useful reviewed monthly, once there’s enough data to show a pattern rather than noise.
- Keep one source of truth. If inspection data lives in one system, maintenance records in a spreadsheet, and cost data in accounting software, nobody can see the full picture. Centralizing the inputs is what makes the dashboard trustworthy.
- Make it mobile-accessible. Foremen and mechanics aren’t at a desk. If the dashboard only works from a computer in the office, it won’t get checked in the field where the decisions actually happen.
- Tie metrics to a threshold, not just a number. “Maintenance cost per asset” means little on its own. “Maintenance cost per asset above X this quarter” tells someone exactly when to look closer.
- Start with fewer metrics, done consistently. A dashboard tracking three KPIs that everyone actually checks beats one tracking fifteen that only get reviewed once a quarter. Add metrics as the habit of checking the dashboard takes hold, not before.
Inspection and Maintenance Workflows That Keep Equipment Working
KPIs are only as good as the workflow feeding them. A few practices connect daily field activity directly to the dashboard instead of leaving it disconnected:
- Route every inspection through one digital system. Paper inspection forms that never make it back to the office are the single biggest reason “inspection completion rate” and “open defects” numbers don’t match reality.
- Turn defects into work orders automatically. The gap between a reported issue and an assigned repair is where most downtime actually accumulates. Closing that gap is what separates a fleet that catches problems early from one that reacts to breakdowns.
- Standardize forms by asset type. A generic checklist doesn’t account for the difference between a crane, a skid steer, and a dump truck. Asset-specific forms catch the issues that actually matter for each type of equipment.
- Keep records audit-ready by default. OSHA and DOT reviews shouldn’t require scrambling for paperwork. Timestamped, photo-verified inspection and maintenance records should already exist for every asset.
- Give every jobsite the same visibility as the main office. Whether a crew is on a single site or spread across five, whoever manages the fleet should see inspection activity, open defects, and maintenance history for every asset without calling around to ask.
Whip Around’s construction vehicle and equipment inspection software is built around this exact connection: digital inspections that flag defects instantly, route them to the right person, and track them through to resolution, with every asset type from trucks to cranes to skid steers covered under custom forms rather than one generic checklist.
Turn Fleet Data Into Better Repair, Replace, and Rental Decisions
Once cost per asset, utilization, and downtime data are tracked consistently, the biggest decisions in construction fleet management stop being guesswork. A unit with rising maintenance cost and falling utilization is a replacement candidate. A piece of equipment needed only a few weeks a year, sitting idle the rest of the time, is often cheaper to rent than to own. An asset with a clean maintenance history and strong utilization is one worth keeping in service longer, not replacing early out of caution.
None of this requires guessing. It requires the data actually being captured consistently across every jobsite, in a system built for how construction fleets operate rather than retrofitted from a general fleet tool. As fleets grow, predictive approaches that flag likely failures before they happen, covered in more depth in our guide to AI for construction fleet management, add another layer to these decisions by surfacing patterns a spreadsheet review would miss.
If you want to see how inspection, maintenance, and cost data come together in one system, you can book a demo or start a free trial to try Whip Around against your own fleet.
FAQs About Construction Equipment Fleet Management
How do you calculate construction fleet operating costs?
Total operating cost per asset includes fuel, scheduled maintenance, unplanned repairs, parts, labor, insurance, and depreciation over a given period. Dividing that total by hours used or by asset gives you a per-unit cost you can compare across the fleet. The most common mistake is leaving out indirect costs like downtime and rental duplication, which often outweigh the repair bill itself.
What should a construction fleet dashboard include?
At minimum, a construction fleet dashboard should track equipment availability rate, preventive maintenance completion rate, inspection completion rate, open defects and resolution time, downtime by asset and jobsite, maintenance cost per asset, planned versus unplanned maintenance, fuel and idle time, asset utilization rate, and parts availability. Together, these metrics connect daily field activity to the repair, replace, and rental decisions that actually affect the budget.
How can construction companies reduce equipment downtime?
Downtime drops when problems are caught before they become breakdowns, which means consistent inspections, a defect-to-work-order process with no manual gaps, and a preventive maintenance schedule that’s actually followed rather than skipped under project pressure. Tracking downtime by asset and cause, rather than as one fleet-wide number, also makes it possible to fix the specific pattern instead of reacting to each incident as a surprise.