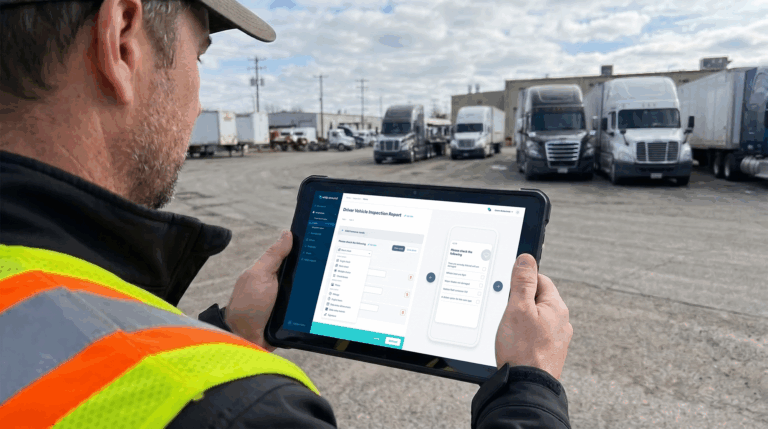
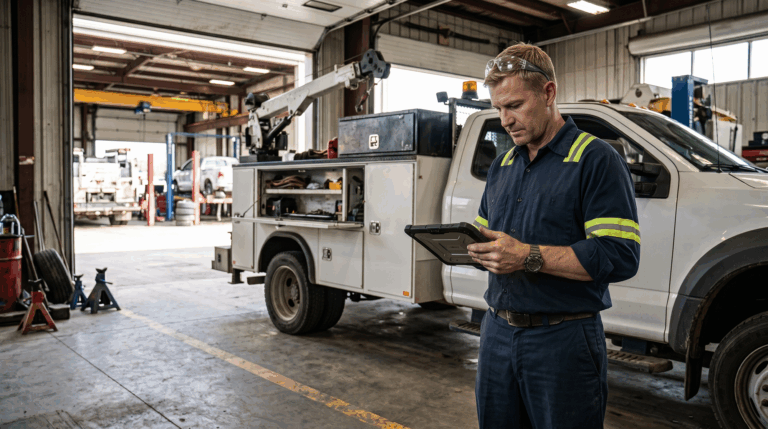
A truck sits in the shop for three days waiting on a part. A landscaping crew burns an extra tank of fuel a week because nobody’s watching idle time. A DVIR gets skipped on a Friday afternoon and nobody notices until an auditor asks for it. None of these show up on a spreadsheet until it’s too late to do anything about them.
That’s the real problem with fleet management KPIs: everyone agrees they matter, but most fleets are trying to measure them with tools that were never built to capture the data in the first place. This article walks through 10 fleet management KPIs that actually move the needle on cost, uptime, safety, and compliance, and explains, KPI by KPI, why the right software is what makes each one trustworthy.
Why KPIs Matter More Than Ever for Fleet Managers
A fleet management KPI is a measurable indicator, like cost per mile, preventive maintenance compliance, or inspection completion rate, that tells you whether your fleet is running efficiently, safely, and within budget. Without KPIs, decisions about repairs, replacements, staffing, and routes are guesses dressed up as judgment calls.
The stakes for getting this right keep going up. Fleet downtime costs U.S. businesses an estimated $50 billion or more per year, and industry benchmarks put the cost of unplanned maintenance at 3 to 9 times higher than planned maintenance. Meanwhile, fuel, insurance, and parts costs keep climbing, and compliance enforcement isn’t getting any lighter. Fleet management KPIs give you a way to catch problems while they’re still cheap to fix, but only if the numbers behind them are accurate and current.
That last part is where most fleets get tripped up. It’s not that fleet managers don’t know utilization rate or cost per mile matter, it’s that pulling an accurate, up-to-date figure for either one usually means logging into two or three different systems, exporting data, and reconciling it by hand before the number means anything at all.
The Problem With Tracking Fleet KPIs Manually
Spreadsheets and paper logs can hold KPI data. What they can’t do is capture it the moment it happens, standardize it across drivers and locations, or flag the things that never get written down at all — the inspection that got skipped, the PM that quietly slipped a week, the fault code nobody logged.
Manual tracking has three built-in failure points. First, there’s data lag: by the time someone transcribes a maintenance log into a spreadsheet, the information is already a day or a week old. Second, there’s inconsistency: one depot tracks downtime in hours, another tracks it in days, and a third doesn’t track it at all. Third, and most costly, manual systems only record what someone remembers to write down, which means the most important KPIs (the near-misses, the missed inspections) are exactly the ones most likely to go unrecorded.
This is why data-driven fleet management has become less of a nice-to-have and more of a baseline requirement. Once vehicle, driver, and maintenance data flows into one system automatically, KPIs stop being a monthly reporting exercise and start being something a manager can act on the same day.
10 Fleet Management KPIs to Track (and Why Software Makes the Difference)
These 10 KPIs span cost, maintenance, compliance, and safety. Each one below explains what “the right software” specifically needs to capture to make the number trustworthy.
1. Vehicle and Asset Utilization Rate
Utilization rate measures how much of a vehicle or asset’s available time is actually spent in productive use, versus sitting idle or out of service. A low utilization rate on a specific truck or piece of equipment is often the first sign that it’s costing more to keep than it’s earning.
The catch is that utilization can’t be estimated from driver-reported mileage or a shared calendar. It requires usage data (engine hours, GPS activity, or telematics-fed status) flowing in automatically for every asset, every day, so you can see which vehicles are earning their keep and which ones are quietly dragging on the budget.
2. Cost Per Mile (or Cost Per Asset)
Cost per mile combines fuel, maintenance, insurance, and depreciation into a single number that tells you what it actually costs to run a vehicle. It’s one of the most-watched KPIs in trucking specifically because it’s the clearest signal of whether a fleet is profitable. According to the American Transportation Research Institute’s 2026 operational cost report, the average cost to run a Class 8 truck reached $2.336 per mile, a useful benchmark for comparing your own fleet against the industry.
Getting an accurate cost-per-mile figure means pulling fuel spend, maintenance costs, and mileage from separate systems and reconciling them by hand, a process that’s slow enough that most fleets only do it monthly, if that. Software that aggregates fuel, maintenance, and mileage data automatically is the only practical way to keep this number current enough to act on.
3. Preventive Maintenance Compliance Rate
This KPI tracks the percentage of scheduled maintenance completed on time versus missed or pushed back. A fleet with a high PM compliance rate catches small issues before they become expensive repairs; a fleet with a low one is quietly building a backlog of deferred maintenance.
A maintenance binder or shared spreadsheet is only accurate on the day someone remembers to update it. Preventative fleet maintenance software that schedules PMs by mileage, engine hours, or calendar date, and automatically flags anything overdue, is what turns this from a best-effort guess into a number you can trust.
4. Mean Time to Repair (MTTR) and Unplanned Downtime
MTTR measures how long a vehicle sits out of service from the moment an issue is reported until the repair is complete. Paired with total unplanned downtime, it tells you how much lost productivity your maintenance process is actually costing.
Both metrics depend on timestamped data: when the defect was reported, when the work order was opened, when the repair was finished. A verbal handoff between a driver and a shop foreman doesn’t leave that trail, a digital work order system does. For a deeper look at MTTR and related metrics, see this breakdown of asset maintenance metrics that improve fleet performance.
5. DVIR and Inspection Completion Rate
This KPI tracks what percentage of required pre-trip and post-trip inspections actually get completed — and how many of them surface real defects. It’s one of the most direct indicators of both safety exposure and audit readiness.
Paper DVIRs are easy to skip, easy to fill out from memory in the cab five minutes after the fact, and easy to lose. Fleet compliance software with DVIR timestamps and geotags every inspection as it’s submitted, which means the completion rate you’re looking at is the real one — not the one that assumes every driver filled out every form correctly and on time.
6. Fuel Consumption and Efficiency (MPG Trends)
Fuel efficiency tracks fuel used relative to miles driven or work performed, broken out by vehicle and by driver. Small, gradual drops in MPG ( a dragging brake, an underinflated tire, a driver’s idling habits) are easy to miss until they’ve cost a fleet thousands of dollars.
Catching that trend requires fuel card and telematics integration, not a monthly total from a fuel receipt pile. Industry research suggests telematics adoption can reduce fuel costs by 10 to 15% on average, largely because fleets can finally see the trend instead of just the total. Fuel management and tracking software is what turns fuel spend from a lagging cost into a KPI you can manage in real time.
7. CSA Score and Compliance Violation Trends
This KPI tracks how a fleet’s safety and compliance record trends over time, based on inspection results, violations, and audit history. FMCSA requires DVIRs for all commercial motor vehicles over 10,000 lbs GVWR, and HOS violations are consistently among the top causes of CSA score points, which makes this KPI as much about recordkeeping as it is about driving behavior.
The single biggest cause of a failed DOT audit isn’t usually a safety failure, it’s a missing record. Software that automatically logs every inspection, defect, and repair builds the audit trail regulators expect, without anyone having to reconstruct it after the fact.
8. Driver Safety and Behavior Score
A driver safety score is a composite rating based on events like harsh braking, speeding, and rapid acceleration, tracked per driver over time. It’s one of the clearest early-warning indicators for accident risk and vehicle wear.
There’s no manual equivalent for this KPI, it simply doesn’t exist without telematics or in-cab event data. A supervisor riding along once a quarter can spot bad habits, but they can’t catch a pattern that only shows up on a specific route or at a specific time of day. Fleets that want to track and improve driver behavior need that data flowing automatically, ideally paired with a way to recognize and reward the drivers doing it right, not just flag the ones doing it wrong.
9. Maintenance Backlog and Work Order Resolution Time
This KPI tracks how many work orders are open at any given time and how long they sit before resolution. A growing backlog is a leading indicator that the maintenance team is falling behind — often before downtime numbers show it.
A shared inbox or a stack of sticky notes on a shop wall makes backlog invisible until it’s a crisis. A shared digital work order queue, where every job is visible, assigned, and time-stamped, is what makes backlog something you can monitor weekly instead of discovering during a slow month.
10. Total Cost of Ownership and Vehicle Replacement Trigger Point
Total cost of ownership adds up everything a vehicle or asset costs over its life (fuel, repairs, downtime, depreciation) to answer the question every fleet manager eventually faces: is it cheaper to keep fixing this truck, or to replace it?
That answer depends on having a complete, accurate cost history for each individual asset. Reconstructing it after the fact from scattered invoices and repair receipts is nearly impossible to do with any confidence, and it’s easy to underestimate how much a vehicle is really costing when downtime and rental replacement costs never get added to the ledger. A consolidated, asset-level cost history, built automatically as maintenance and fuel data comes in, is what makes the replacement decision a data-backed call instead of a gut call.
Common Mistakes When Tracking Fleet KPIs
Most fleets don’t fail at choosing the right KPIs, they fail at capturing consistent, timely data for them. A few mistakes show up again and again:
- Reviewing KPIs monthly instead of in real time. By the time a monthly report flags a downtime spike, the cost has already been absorbed.
- Letting each depot or location track data differently. Inconsistent definitions of “downtime” or “completed inspection” make fleet-wide comparisons meaningless.
- Treating cost KPIs and compliance KPIs as separate systems. Maintenance costs, fuel spend, and inspection compliance are all connected — tracking them in isolation hides the story.
- Trying to track too many KPIs at once. A dashboard with 30 metrics and no owner for any of them doesn’t drive action; a handful of well-owned KPIs does.
How to Turn Fleet KPI Data Into Action
A KPI only matters if it changes a decision. That means giving each metric a review cadence, an owner, and a threshold that triggers action.
- Set a cadence. Review operational KPIs (utilization, downtime, inspection completion) weekly; review cost and compliance trends monthly.
- Assign an owner. Every KPI should have one person responsible for reviewing it and acting on it,not a dashboard everyone looks at and no one owns.
- Set thresholds, not just totals. A PM compliance rate that drops below 90%, or an MTTR that creeps past 48 hours, should trigger an alert automatically rather than waiting for someone to notice on a report.
This is where automated dashboards earn their keep. Instead of a manager pulling numbers from three systems every Friday, Whip Around can surface overdue maintenance, failed inspections, and cost trends the moment they happen, so the threshold-based alerts above aren’t a manual process either.
How Whip Around Helps You Track These KPIs Automatically
Good KPI tracking requires data that’s current, consistent, and pulled from every part of the fleet (inspections, maintenance, fuel, and compliance) in one place. That’s the gap fleet reporting software with custom dashboards is built to close.
Whip Around pulls inspection results, work orders, PM schedules, and fuel data into dashboards that update in real time, with drill-down views for individual assets and automated report scheduling so managers aren’t exporting spreadsheets by hand. Failed inspections generate work orders automatically, PM reminders go out before a service interval is missed, and compliance records are stored and exportable for audits without anyone digging through a filing cabinet. For driver safety KPIs, leaderboard features make it easy to recognize safe behavior instead of just flagging risky behavior after the fact.
Belknap Landscape used this approach to stay ahead of DOT compliance requirements across its fleet, read the full case study to see how automated inspection and compliance tracking changed their audit readiness. Whip Around is built for fleet managers who need these KPIs to be trustworthy enough to act on the same day the data comes in, not the week after.
Conclusion
These 10 fleet management KPIs — utilization, cost per mile, PM compliance, MTTR, inspection completion, fuel efficiency, CSA score, driver safety, maintenance backlog, and total cost of ownership — are only as useful as the data behind them. Manual tracking will always leave gaps, and in fleet management, gaps turn into missed repairs, failed audits, and costs nobody saw coming.
The fix isn’t tracking more KPIs. It’s making sure the ones that matter are backed by data you can trust the moment you look at it. Book a demo to see how Whip Around’s dashboards and reporting turn fleet data into KPIs you can actually act on, or start a free trial to try it on your own fleet.