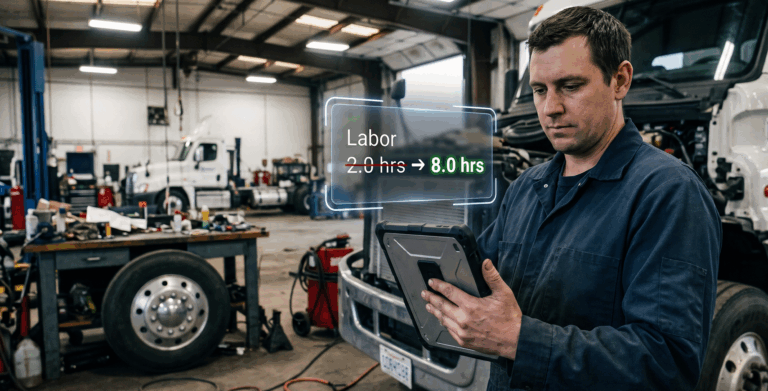
The work order said two hours. The technician pulled the wheel, found a cracked hub, waited half a day on parts, and closed the job eight hours later. Multiply that by every truck, trailer, and piece of equipment in your fleet, and it’s easy to see why the maintenance budget never matches what was spent.
Fleet labor costs are one of the most important lines in a maintenance budget and one of the hardest to forecast. Parts have invoices and fuel has receipts, but labor depends on how long jobs really take, how productive your technicians are, and how much work shows up unplanned. This guide explains why fleet maintenance labor costs are so hard to predict, how to estimate them accurately, and which capabilities make the difference.
What Are Fleet Labor Costs?
Fleet labor costs are the total cost of the people who inspect, maintain, and repair your vehicles and equipment, including in-house technician wages, benefits, overtime, and overhead, plus labor billed by outside repair shops. They’re usually tracked per work order, per asset, or per mile, and they make up a large share of total maintenance spend.
The challenge is that the labor you pay for and the labor that goes into repairs are rarely the same number. A technician may be paid for 40 hours a week but spend only part of that time working on vehicles. The rest goes to waiting on parts, tracking down approvals, moving equipment, and doing paperwork. Accurate estimates start with knowing the difference.
Why Fleet Labor Costs Are So Hard to Predict
Maintenance costs are rising, and they’re becoming less predictable. ATRI’s 2026 Analysis of the Operational Costs of Trucking found that repair and maintenance costs per mile rose 8.6% in 2025, one of the largest increases of any cost category. Several factors make the labor side especially hard to forecast.
Unplanned Repairs Don’t Follow a Schedule
Preventive maintenance is predictable. You know when the next PM is due and roughly how long it takes. Breakdowns aren’t. According to ATRI data reported by Fleet Maintenance, the average miles between breakdowns or unscheduled repairs fell from 38,249 in 2024 to 36,891 in 2025, while average truck age rose from 3.4 to 3.6 years.
Every unplanned repair pulls technicians off scheduled work, which pushes PMs back and creates more catch-up labor later. The more reactive your shop, the wider the gap between your labor forecast and reality.
Job Scope Changes Once the Work Starts
A driver reports a brake noise. The technician finds worn pads, then a scored rotor, then a leaking wheel seal. Diagnosis often uncovers more work than the original complaint, and the labor estimate grows with each discovery.
Off-road equipment, specialty bodies, and mixed fleets make this harder. Standard labor guides don’t exist for every asset type, so estimates for an excavator hydraulic repair or a refuse truck packer often come down to a technician’s best guess.
Paid Hours Aren’t Productive Hours
Technician utilization measures the share of available hours spent on actual work orders. If a technician books 30 of 40 available hours, utilization is 75%. The other 25% still shows up on payroll, so every productive hour costs more than the technician’s base wage.
That gap moves around. Parts delays, approval bottlenecks, shop congestion, and travel to field assets all lower utilization unpredictably. A forecast based on base wages alone will consistently come in under actual cost.
Time Data Is Often Incomplete or Inaccurate
Many fleets still rely on technicians estimating their hours at the end of a shift or entering time after the fact. Memory isn’t precise, and a forgotten clock-out can inflate a two-hour job into a ten-hour one. When the underlying time data is unreliable, every estimate built on it is unreliable too.
Even fleets with good maintenance software often track labor at the work order level instead of by job line, which makes it hard to know how long a specific task takes. Without that detail, you can’t build accurate estimates for the next time the same job comes up.
Technician Shortages Drive Overtime and Outsourcing
Skilled technicians are hard to hire and keep. The U.S. Bureau of Labor Statistics projects about 24,400 openings for diesel service technicians each year through 2035. TechForce Foundation found that from 2022 to 2023, projections called for 55,000 new diesel technicians, but only 8,600 were added, according to Fleet Maintenance.
When your shop is short-staffed, the work still has to get done. Overtime premiums and outside repair shops fill the gap, and both cost more than in-house labor at standard rates. Outside labor is also harder to compare, since every vendor bills differently.
How to Estimate Fleet Labor Costs Accurately
The core formula is simple:
Estimated labor cost = estimated labor hours × fully loaded labor rate
Getting both inputs right is where most fleets struggle. These steps will tighten your estimates over time.
1. Calculate Your Fully Loaded Labor Rate
A technician’s hourly wage isn’t the true cost of an hour of labor. A fully loaded labor rate includes wages, benefits, payroll taxes, workers’ compensation, and shop overhead. Then divide by utilization to get the cost per productive hour.
For example, the BLS median pay for diesel technicians is $29.70 per hour. Assume a 30% burden for benefits and taxes, and the loaded cost is about $38.60 per hour. At 75% utilization, the real cost per productive hour is about $51.50, roughly 73% higher than the base wage. Use your own payroll data and utilization rates for the most accurate numbers.
2. Capture Actual Time Against Every Job
Estimates are only as good as the data behind them. Have technicians clock in and out against specific work order line items instead of logging hours at the end of the day. That shows how long each type of job takes, not just how long the whole work order was open.
Build in safeguards for bad data. Automatic clock-outs and stale timer reviews keep a forgotten timer from distorting your labor cost. For a deeper look at which metrics to watch, see our guide to fleet labor reporting metrics.
3. Build Estimates From Your Own History
Industry labor guides are a starting point, but your own data is more accurate. Your technicians, equipment, and operating conditions are unique. Group completed jobs by repair type and asset class, then use the median time to set the estimate for future work. The median is usually better than the average because a single outlier job won’t skew it.
Over time, this gives you estimates for the jobs labor guides don’t cover, like specialty equipment, upfits, and the repairs that come up again and again in your fleet.
4. Compare Estimated vs. Actual Labor
Every closed work order is a chance to improve your next estimate. Track estimated vs. actual labor by job type, technician, and asset. Consistent overruns on a job type mean the estimate is wrong. Overruns on one asset may point to a unit that’s costing more than it’s worth. Overruns by one technician may signal a training need.
Look at why the gap happened, too. Scope changes, additional damage, and parts delays each call for a different fix.
5. Separate Wrench Time From Wait Time
Time to repair, the total time an asset is out of service, is different from labor time. A job might need three hours of hands-on work but keep a truck in the shop for three days while it waits for parts or approval. Tracking both shows where downtime comes from and keeps wait time from being confused with labor cost.
Cost-based approval rules help here. Routine repairs under a set dollar amount can move forward without waiting, while larger jobs still get reviewed. Less time waiting for sign-off means higher utilization and faster turnaround.
6. Shift More Work From Unplanned to Planned
The most effective way to make fleet labor costs predictable is to reduce the work you can’t predict. A consistent preventive maintenance program turns surprise repairs into scheduled jobs with known labor times. Driver inspections catch small issues before they become major repairs.
When defects from a DVIR automatically become work orders, small problems get fixed while they’re still small. Belknap Landscape has caught 10,826 defects before they became breakdowns, with an estimated 12,700+ hours of unplanned downtime prevented and a median work order resolution time of 1.2 days.
7. Account for Outside Labor
Outsourced repairs belong in your labor forecast. Record outside shop labor hours and rates on the work order alongside in-house time, so you can compare the true cost of each option. Over time, you’ll see which jobs make sense to send out and which ones your team handles more cheaply.
What to Look for in Labor Cost Tools
Spreadsheets can calculate a loaded labor rate, but they can’t capture accurate time data or show you trends across hundreds of work orders. The right maintenance platform should give you:
- Time tracking tied to work orders: technicians clock in and out against specific job lines, with automatic clock-outs for forgotten timers
- Per-technician labor rates: so booked hours become actual labor cost on every work order
- Estimated vs. actual labor reporting: to show where estimates miss and why
- Utilization and time-to-repair reporting: by asset and by technician
- Cost-based approval workflows: routine work keeps moving and larger expenses stay controlled
- AI document capture: to pull data from outside vendor invoices and receipts into maintenance records without manual entry
- One connected workflow: inspections, defects, work orders, labor, and invoices in one place
Whip Around’s shop management tools bring labor tracking, scheduling, approvals, and billing into the same work orders your team already uses. Every work order shows actual labor cost alongside time-vs-estimate, and fleet reporting breaks down utilization and time to repair by asset and technician. AI-powered invoice and receipt capture turns outside repair bills into maintenance records, so in-house and outsourced labor costs sit side by side.
The result is a labor forecast built on what happened, not what someone remembered. Reed Erskine, President at ACME Logistics, said that after adopting Whip Around, “We started to see our maintenance costs come down, resulting in over 30% per month in savings.” Learn more about how these capabilities fit together in our Advanced Maintenance announcement.
Frequently Asked Questions About Fleet Labor Costs
How do you calculate fleet maintenance labor costs?
Multiply the labor hours for each job by your fully loaded labor rate. The loaded rate includes wages, benefits, payroll taxes, and overhead, divided by technician utilization to reflect the cost of each productive hour. Add outside shop labor to get your total.
What is a good technician utilization rate?
It depends on your shop’s mix of work, travel, and administrative tasks. Many fleets track utilization as the share of available hours booked to work orders. The trend matters more than any single benchmark: falling utilization usually signals parts delays, approval bottlenecks, or scheduling gaps.
Why are my labor estimates always too low?
The most common causes are using base wages instead of a fully loaded rate, ignoring non-productive time, estimating from industry guides instead of your own job history, and scope changes found during diagnosis. Tracking estimated vs. actual labor by job type shows which of these is driving the gap.
What’s the difference between labor time and time to repair?
Labor time is the hands-on hours a technician spends on a job. Time to repair is the total time an asset is out of service, including waiting on parts, approvals, or shop capacity. A job can have low labor time and a long time to repair.
How can I make fleet labor costs more predictable?
Shift more work from unplanned repairs to scheduled preventive maintenance, capture time accurately against every work order, build estimates from your own repair history, and review estimated vs. actual labor regularly.
Turn Labor Data Into Accurate Forecasts
Fleet labor costs will never be perfectly predictable, but they don’t have to be a surprise. When every labor hour is tied to a work order, every estimate is checked against the actual time, and every outside invoice is captured, your forecast gets more accurate with each job you close.
See how Whip Around helps fleets track labor, compare estimates to actuals, and understand true repair costs. Book a demo or start a free trial today.